This week’s infographic comes to us from the Fredericton Community Action Group on Homelessness and looks at two surveys conducted in New Brunswick’s capital earlier this year. The group brings together non-profit organizations, government representatives and community leads who are working together to end homelessness in Fredericton. Data was gathered by a team composed of over 40 volunteers and 10 partner agencies. The infographic contains data collected for the 20, 000 Homes Campaign and the Coordinated Point-in-Time Count.
20,000 Homes Campaign
The 20,000 Homes Campaign, led by the Canadian Alliance to End Homelessness, is a Canadian adaptation of the highly successful 100,000 Homes Campaign. The latter has been successful in placing an estimated 105,580 chronically homeless people in hundreds of communities across the United States into permanent supportive housing. Both campaigns advocate for the widespread use and implementation of Housing First programs. The term Housing First refers to a “recovery-oriented approach to ending homelessness that centers on quickly moving people experiencing homelessness into independent and permanent housing and then providing additional supports and services as needed.”
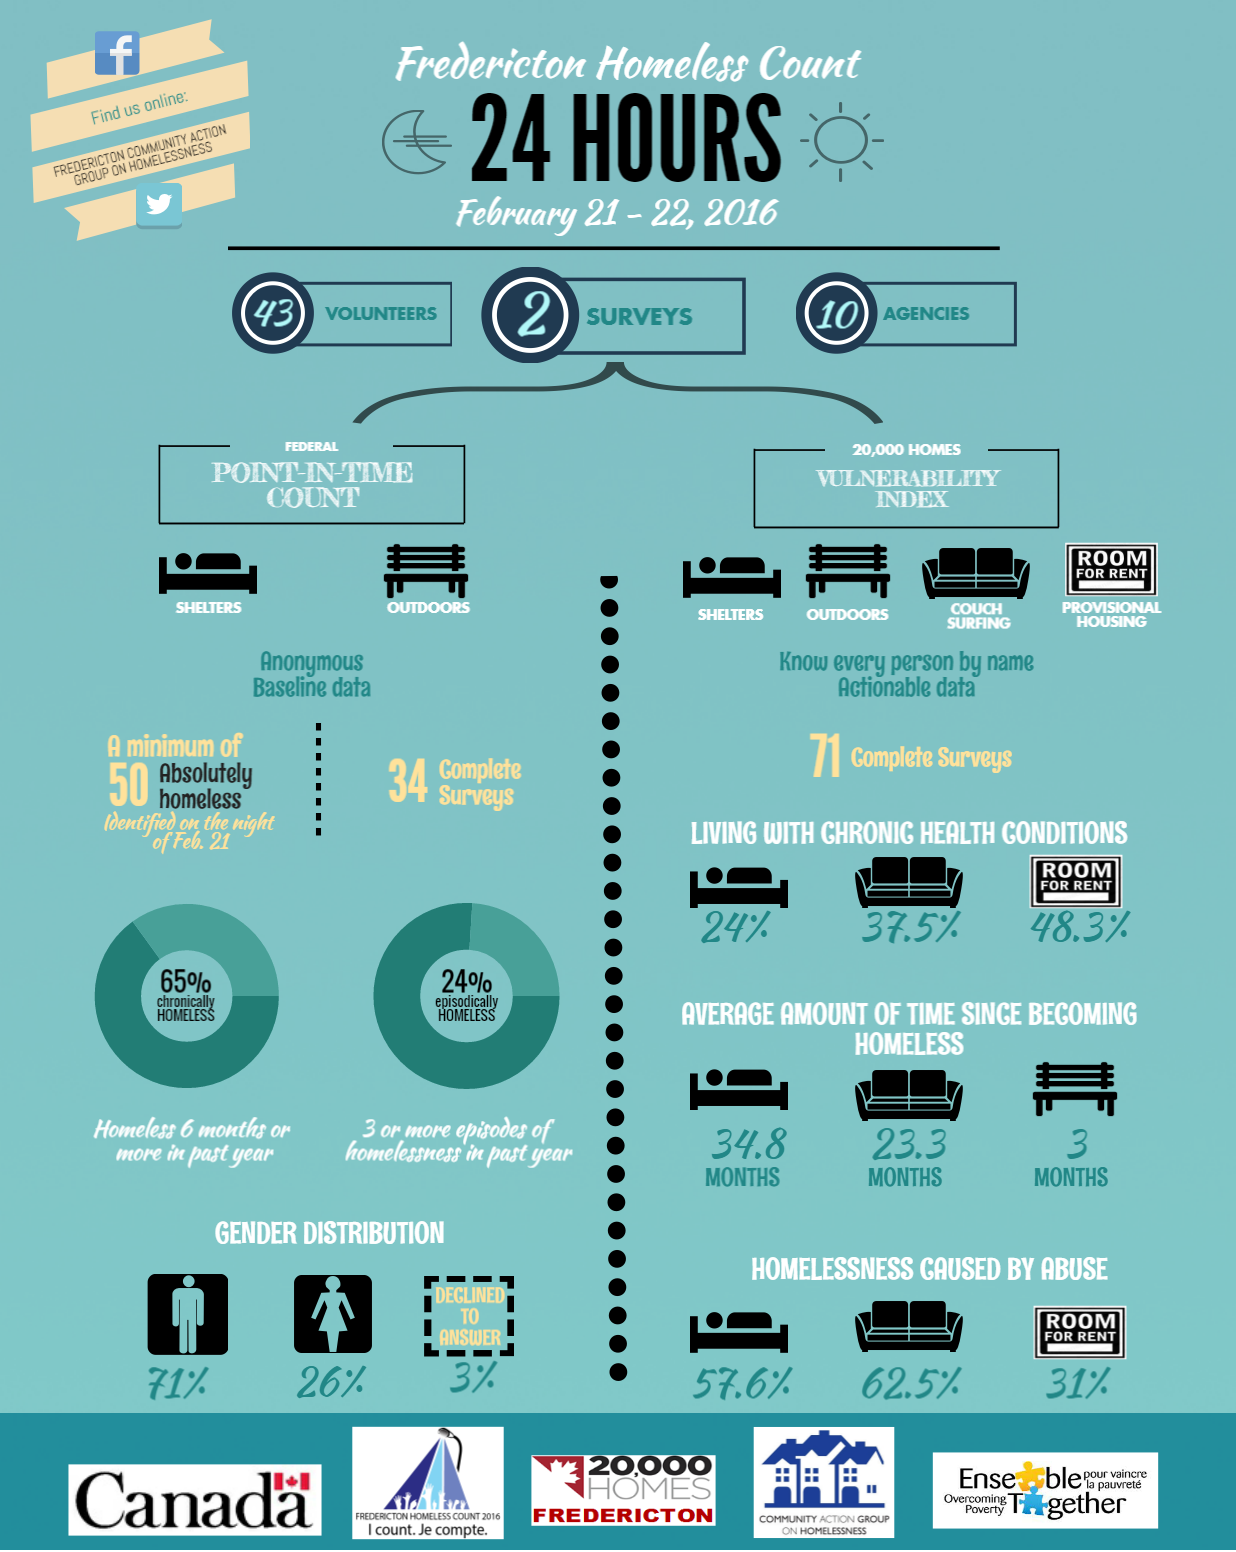
The Vulnerability Index, referred to in the infographic, is a tool developed for the 20,000 Homes Campaign that examines factors around present vulnerability and future housing stability of individuals living in chronic homelessness. The infographic showcases a few overall findings from 71 of these surveys that were completed by individuals living in homelessness. Completed surveys revealed that those who had been living in shelters had been homeless for an average of 34.8 months, almost three years! Furthermore, over half of all individuals who had been living in shelters or couch-surfing stated that their homelessness had been at least partially caused by abuse.
Coordinated Point-in-Time Count
For the first time ever, communities across the country are participating in a coordinated Point-in-Time Count of homelessness, led by the Government of Canada’s Homelessness Partnering Strategy. A Point-in-Time Count is a method used to measure both unsheltered and sheltered homelessness. Across Canada, communities are using the same research methodology, at the same time of year, for the homeless count. This makes it easier to conduct comparative analyses between communities, and makes it easier to aggregate cross-community data.
The infographic states that 34 surveys were completed by homeless individuals living outdoors or in shelters participated in Fredericton’s PiT Count and a total of 50 individuals were found to be experiencing homelessness during the count. Among the group surveyed, 65% were considered to be chronically homeless, which was defined in the study as being homeless for six months or more in the previous year. Almost a quarter of those surveyed stated that they had experienced three or more episodes of homelessness in the past year. It is important to note that the sample was mainly composed of males, a gendered analysis of the same data may reveal important links that may exist between gender and the living experiences of Fredericton’s homeless individuals
A full report of the detailed findings is set to be released later this month and will inform the community on the state of homelessness in the Fredericton. Gathering data on the housing needs and experiences of individuals living in homelessness can play a critical role in guiding the development and implementation of supports and services in the sector. Collecting, and using this data properly is of the utmost importance to ensure the successful adoption of service models that have seen proven effectiveness elsewhere and are being adapted to meet the needs of a local population.