
This week’s infographic comes to us from the City of Vancouver, and details summary findings from the 2016 Homeless Count, actions to date on housing and shelters, and a snapshot of Vancouver’s next steps in ending homelessness.
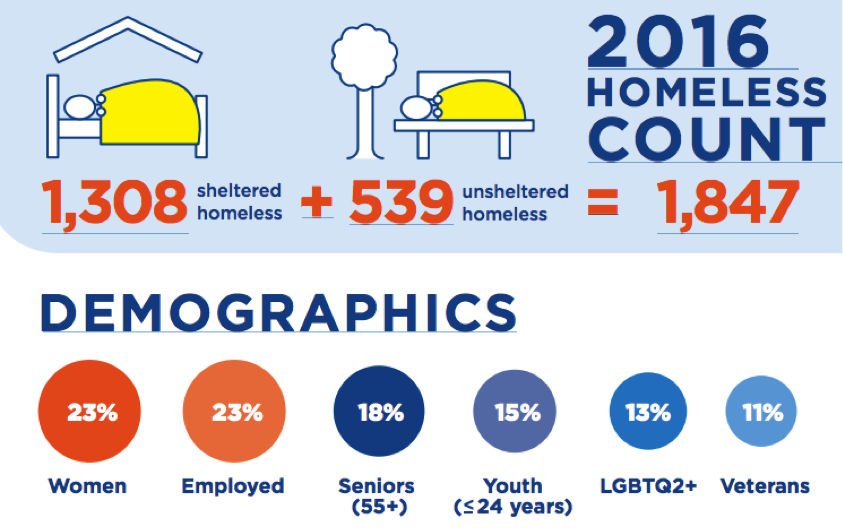
On March 10th, 2016, volunteers canvassed Vancouver’s streets, as part of the city’s tenth annual homelessness count. The annual Point-in-Time (PiT) Count provides a 24-hour snapshot of the number of people in Vancouver experiencing sheltered and unsheltered homelessness. The collected data provides information to communities about the population of people experiencing homelessness, which can support better planning and outreach programs, and when collected regularly, allow communities to assess their progress towards ending homelessness.
The Vancouver 2016 Point-in-Time Count found 1,847 people experiencing homelessness, 1,308 sheltered and 539 unsheltered. Youth comprised 15% of the surveyed homeless population in Vancouver, and 13% of the identified as LGBTQ2S+.
Other findings from the Vancouver 2016 Point-in-Time Count include:
- 61% had experienced homelessness for less than one year, while 39% had experienced it for more than a year.
- 78% had one or more health conditions, 53% were experiencing an addiction, 40% had a mental health condition and 31% had a physical disability.
Key Drivers of Homelessness
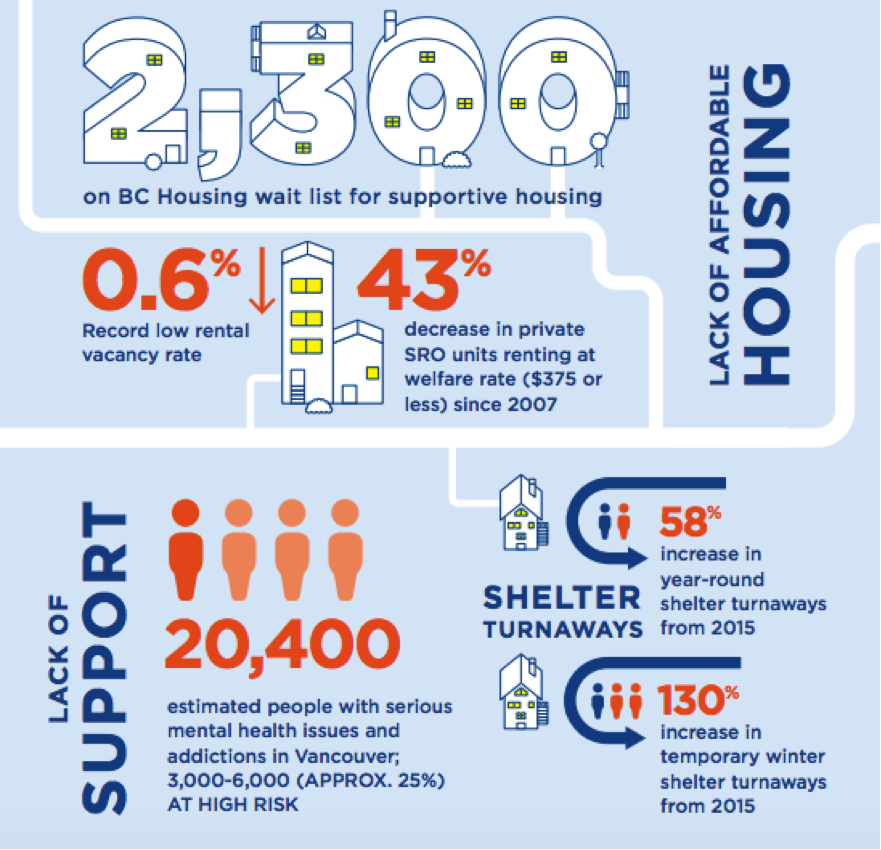
Poverty, a lack of affordable housing and a lack of support are outlined in the infographic as some of the key drivers of homelessness in Vancouver. Over 29% of Vancouver’s renter households are in Core Housing Need, spending more than 30% of their income on shelter. Furthermore, 2,300 individuals are currently on British Columbia’s housing wait list for supportive housing. In addition to the lack of affordable housing, the report found an increase in shelter turnaways, with a 58% increase in year-round turnaways and a 130% increase in temporary winter shelter turnaways.
Housing and Shelters
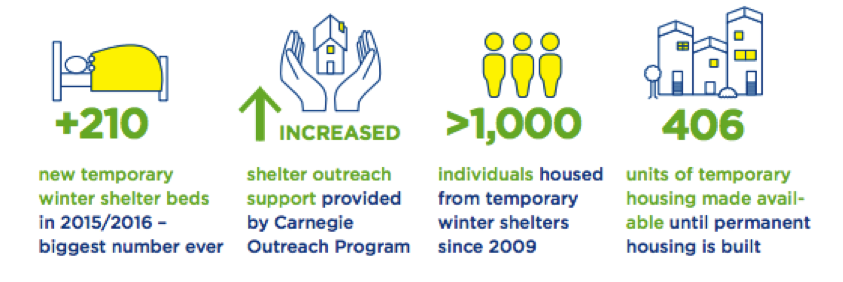
To date, Vancouver has created 210 new temporary winter shelter beds, housed over 1,000 individuals using temporary winter shelters, and created 406 new temporary housing units.
What's Next?
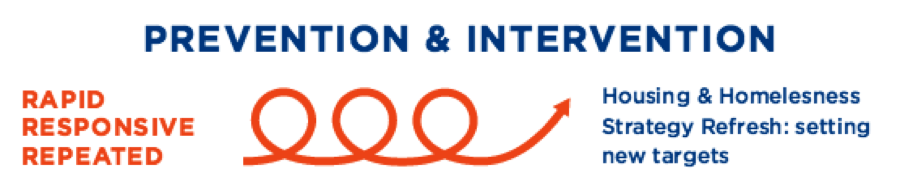
The infographic also outlines Vancouver’s housing and homelessness strategy, focused on prevention and early intervention, and the city’s new targets for the 2016/2017 year.
Vancouver plans to use 20 pieces of city-owned land, valued at a total of $250 million, to develop 3,500 new affordable housing units, and will create temporary housing until permanent housing can be built. The city also plans to construct additional social and supportive housing by using the $85 million allocated in the city’s 2015-2018 Capital Plan. To combat the issue of shelter turnaways, Vancouver is planning to secure an additional 600 beds in winter shelters or temporary housing for the 2016/2017 year.
Get involved and get informed
Encouragingly, 93% of Vancouver residents believe it is important to solve homelessness. The final section of the infographic suggests ways that you can get involved in your community, including volunteering with local non-profits and supporting projects aimed at solving homelessness. The infographic also provides a number of additional resources for more information about homelessness, listed below:
- City of Vancouver
- The Homeless Hub
- Canadian Alliance to End Homelessness
- Streetohome Foundation
- Canada Without Poverty
- Food Banks Canada
- BC Housing Supportive Housing & Housing Registry
- TRAC Tenant Resource & Advisory Centre
To learn more, watch the video below or visit the Vancouver Housing and Homelessness website.